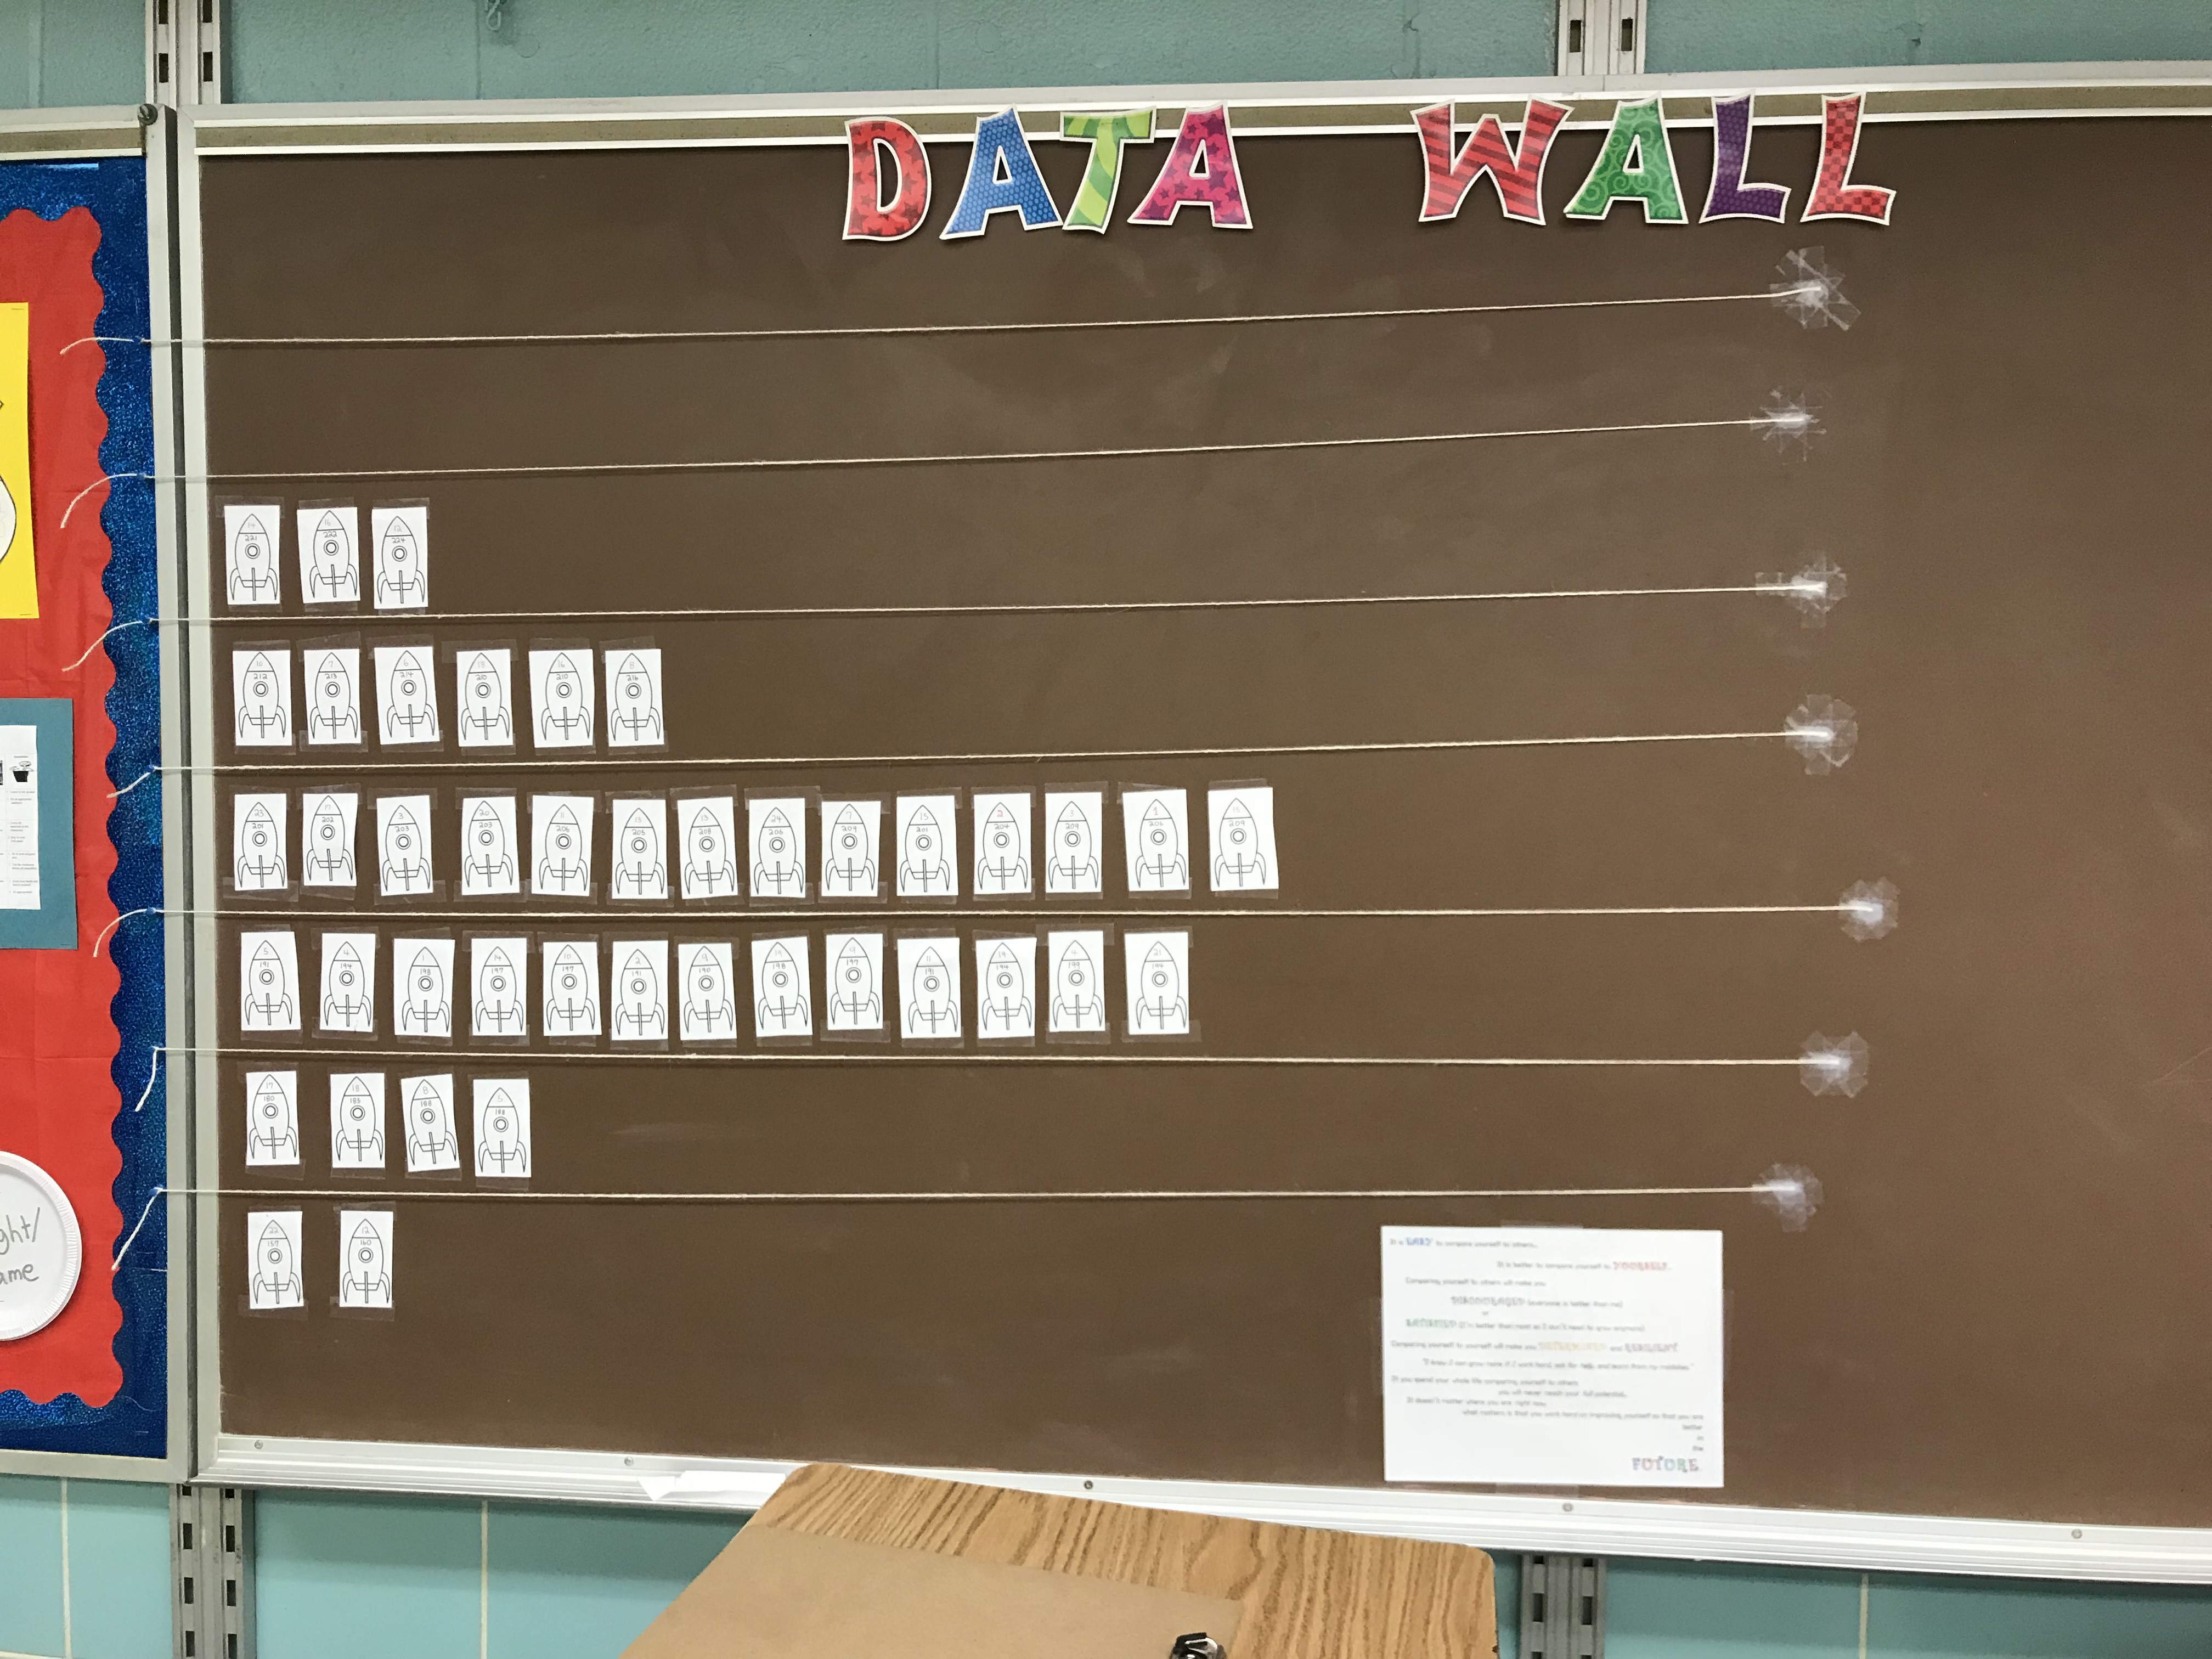
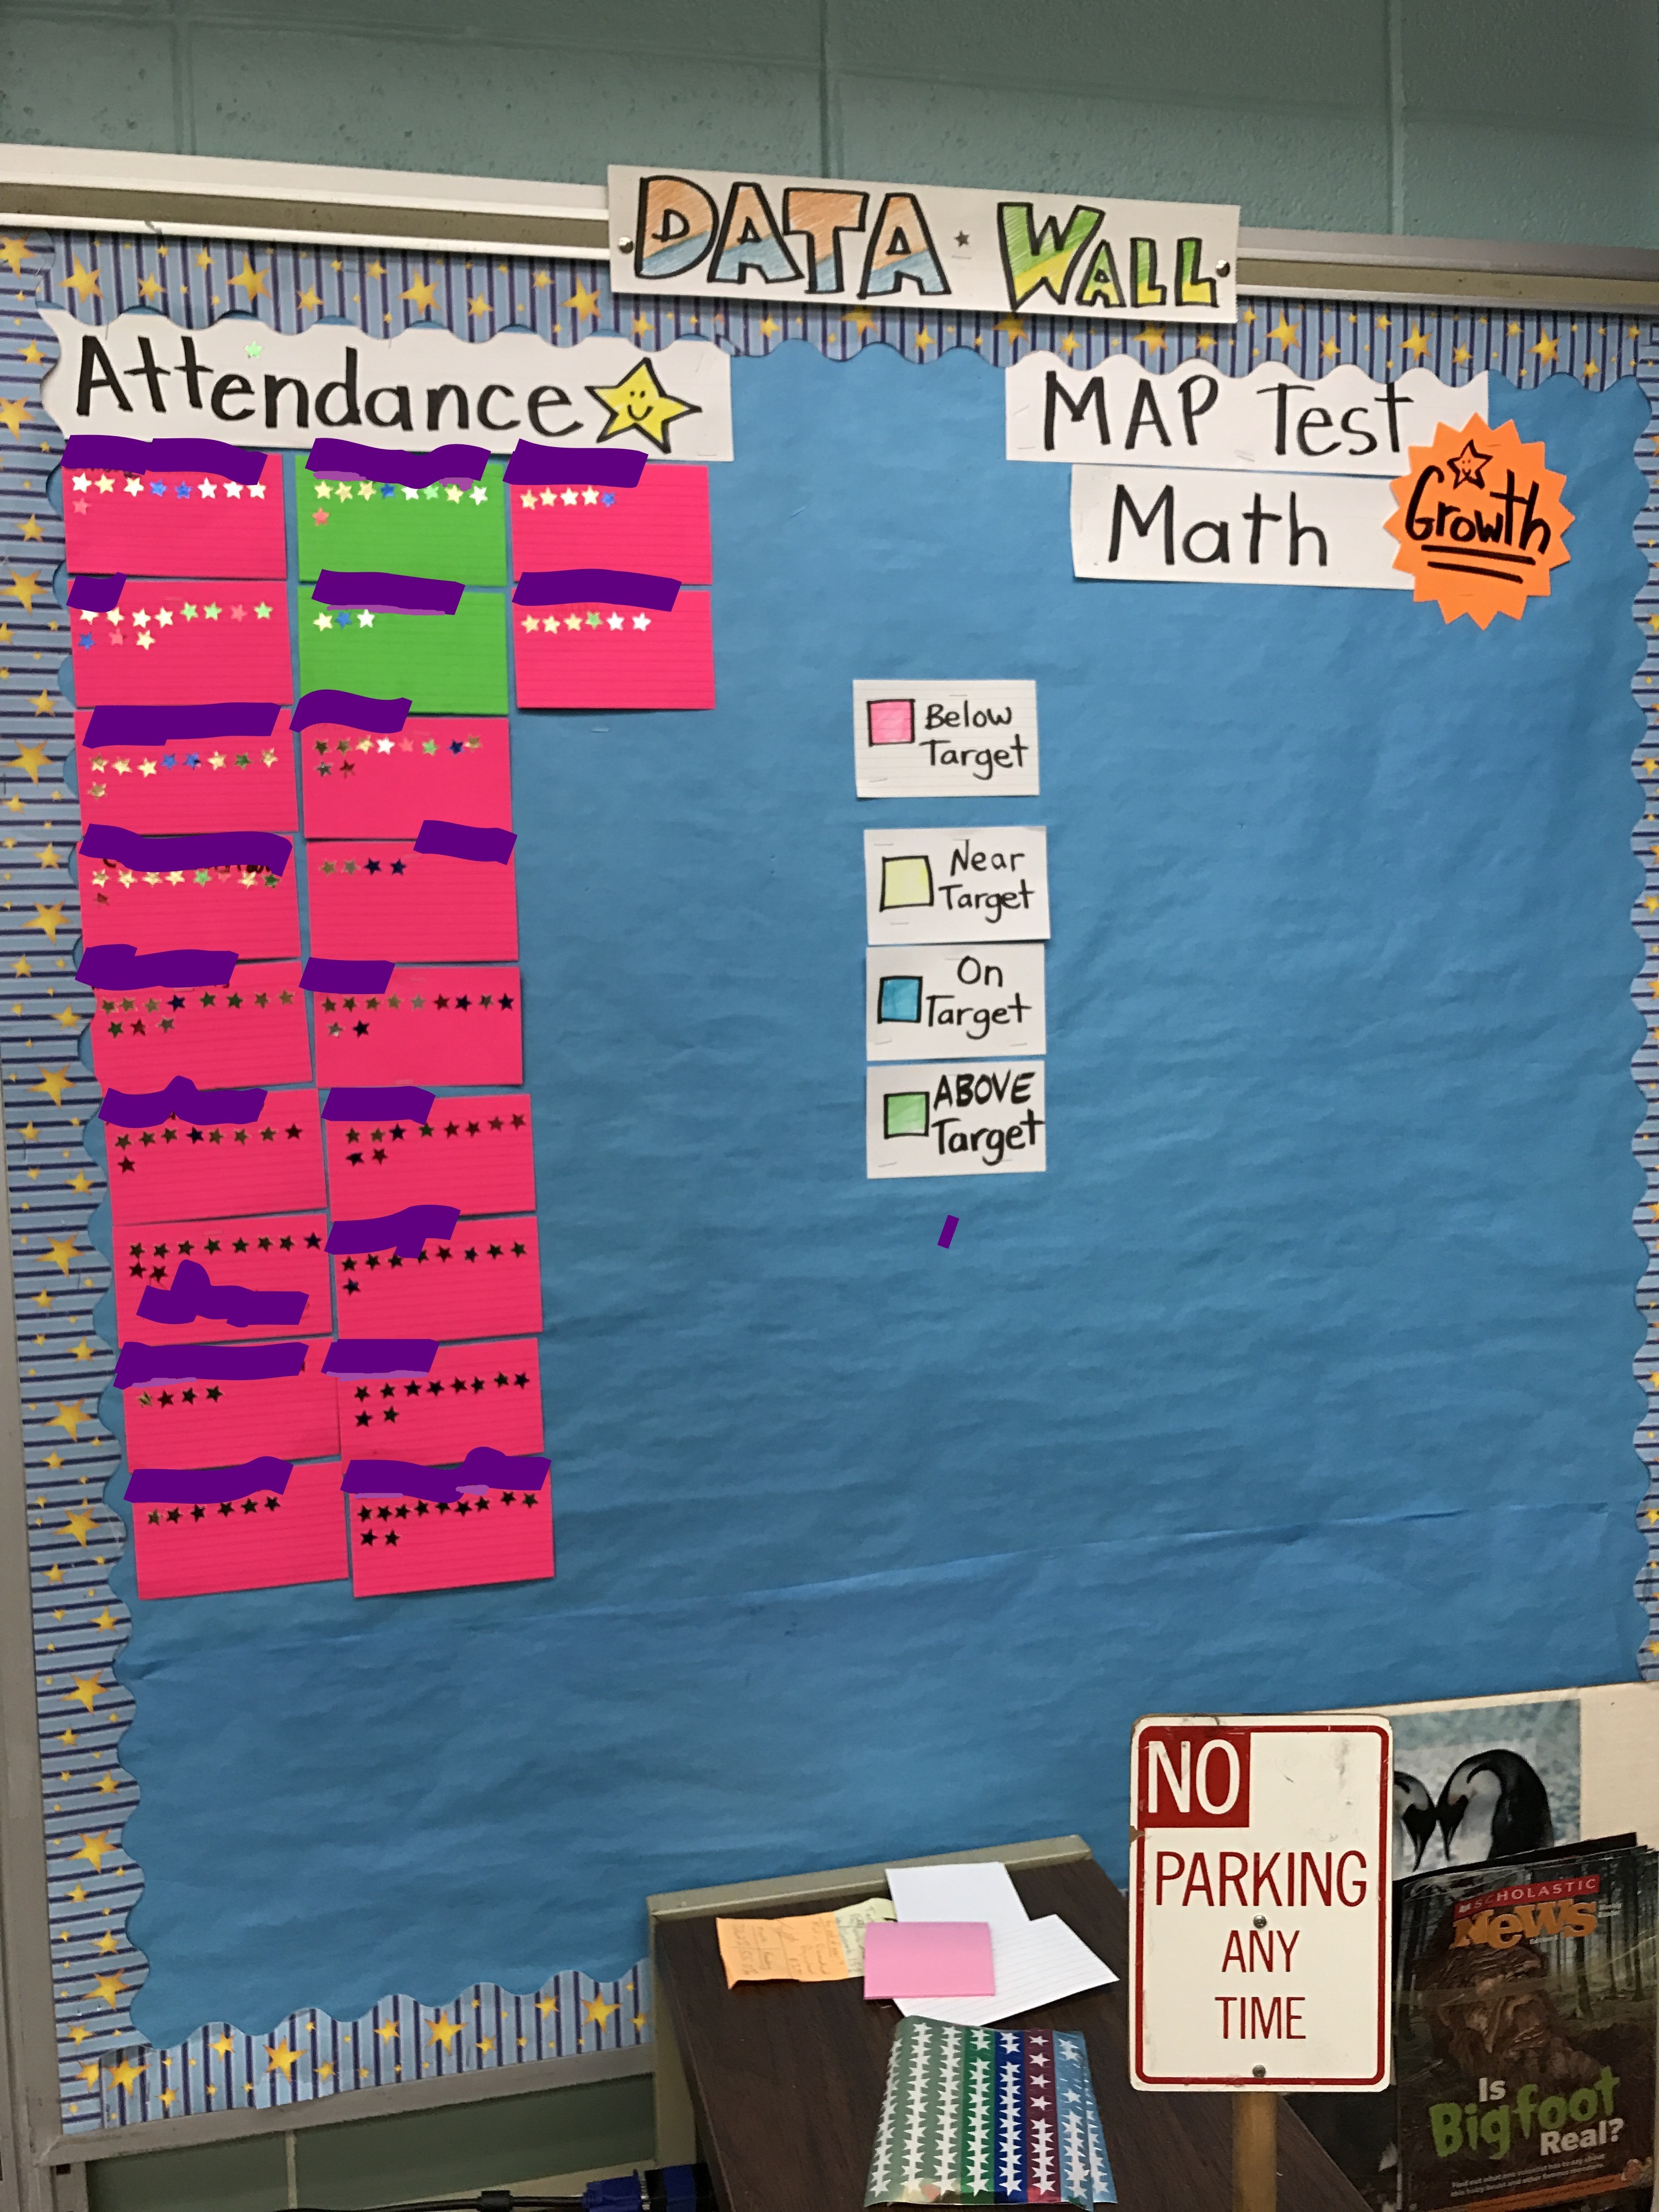
 I wince to think of “data rooms,” those conglomerations of bright, cheery borders, index cards, spreadsheets, and bar graphs representing test scores. How many hours and dollars have district administrative leaders put into these rooms, one of the latest educational fashions? As I spend my retirement years subbing, in school after school — especially in financially and academically-disadvantaged districts — I find similar rooms. How much time did these elaborate displays take away from lesson planning, tutoring and actual instruction? What if we had used that data-room time and money for instruction instead? Let me observe that in the wealthier districts where I sub, nobody seems to be bothering with data rooms. Teachers in these districts keep focusing on lesson planning and instruction instead, while their students, who were already ahead, receive more teacher time because their teachers don’t need to maintain data walls.
Do we need these data rooms? I never benefitted from my school’s room. That cheery, number-filled room contained no surprises. After a few weeks of instruction, I knew who was struggling before the benchmark tests began. How could I not? I graded the papers, quizzes and tests. I sat down to read with individual students. I showed them how to use their math manipulatives. My data came at me moment after moment, day after day.
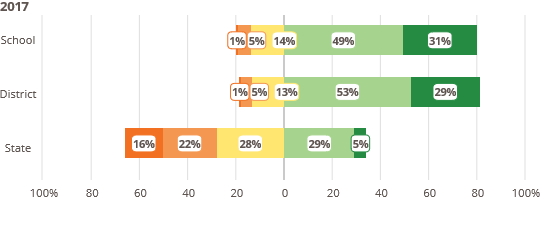
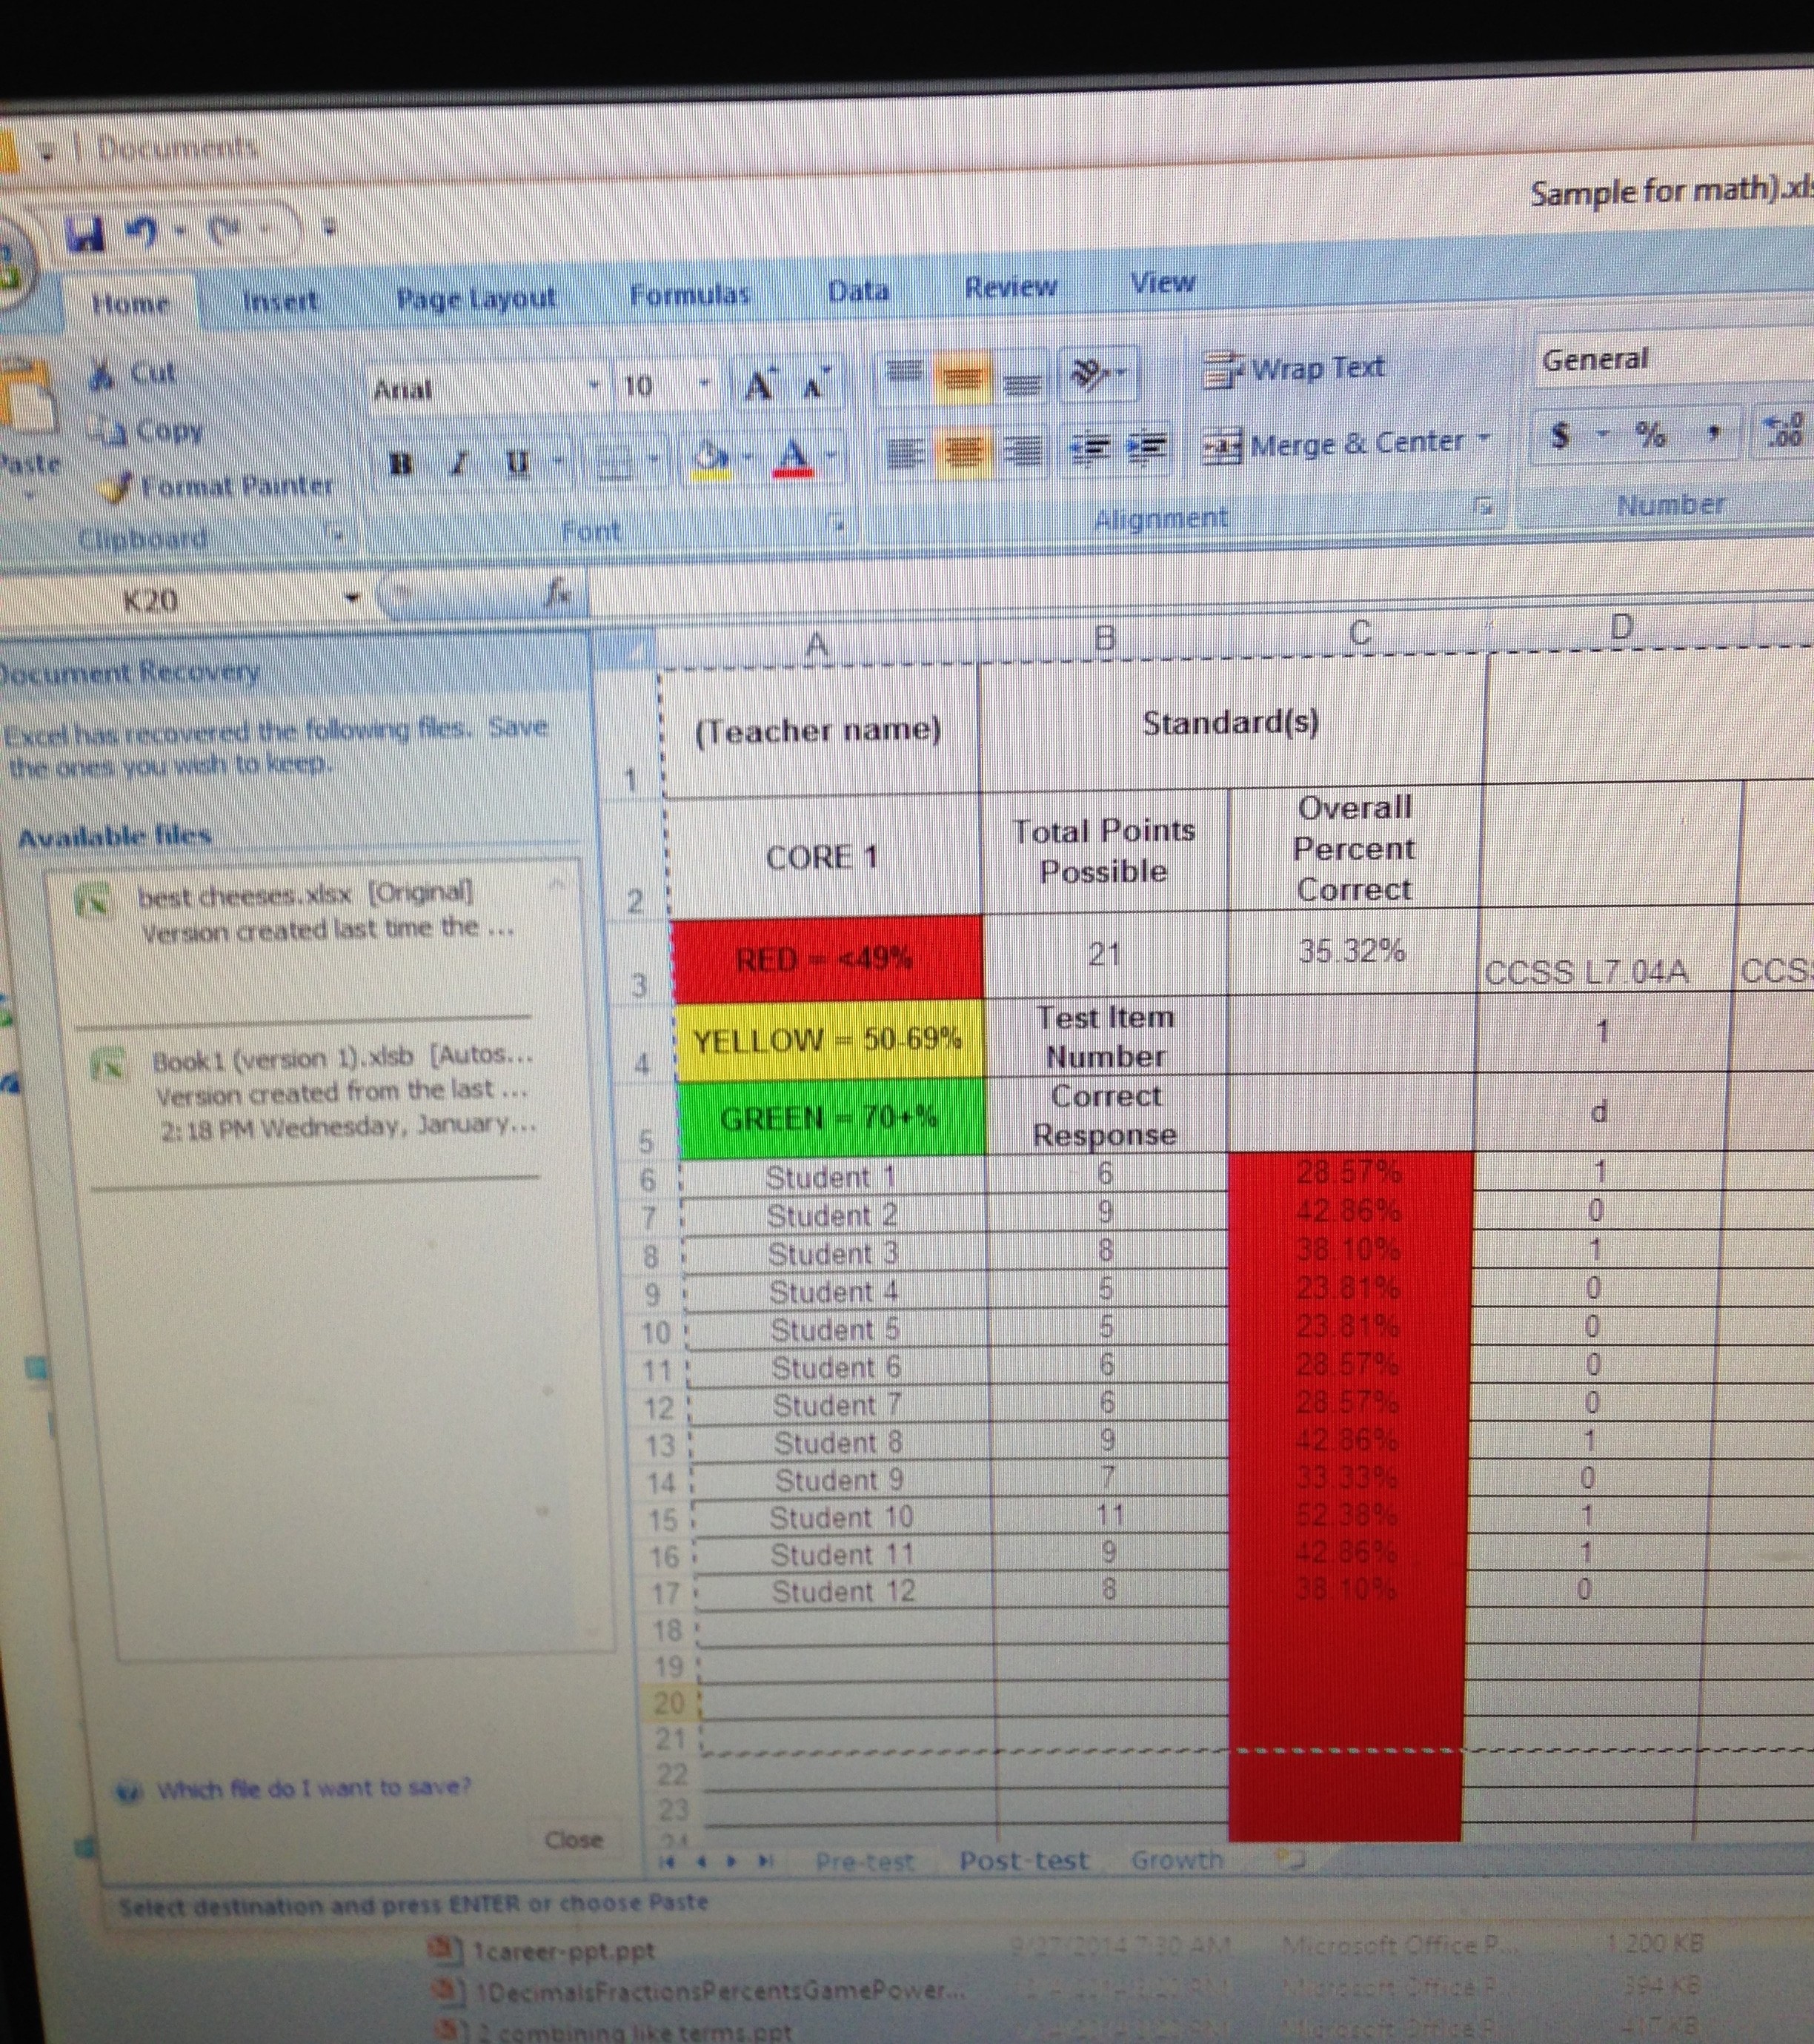
The brightly-colored spreadsheets — red for “SCREECH! CRASH! BOOM!”, yellow for “Watch out!” and green for “We will leave you alone for now, kid,” — did not inform my teaching. All those spreadsheets did was make my lower-scoring students feel like garbage. Did administrators not understand that those numbers sometimes hurt lower-scoring kids, at least kids who had not detached from the whole number, number, number scene?
Fortunately for my students, that room was seldom used on students. It mostly served to make special education and bilingual teachers feel threatened, as they struggled to match other colleagues numbers, understanding that in this time of “No Excuses!” their students’ failures were reflecting badly on them, and providing ammunition that could be used to lower evaluations. One of my colleagues in special education took to teaching mandated tests on Friday and giving the same tests on Monday as she tried to compensate for the fact that a number of her students could not even read the tests required by administration.
The internet and print media would be trumpeting any resulting surge in test scores if a data-related surge had been seen. Those stories are not out there, a few anecdotal exceptions at some “Central Elementary Schools” aside, while the
already too-short school year loses more teacher days to costly data demands. I have given up many hours over evenings, days and week-ends toward data-gathering costs, and I would say upwards of 85% of those hours were barely reviewed by administrators, when they were reviewed at all.Ummm… since it’s not working, can we please stop now?