
I keep intending to get back to the homework thread for new teachers, but having added a chart from the Illinois state interactive report card that shows some score adjustments made between 2012 and 2013, I thought I would add two other charts demonstrating the impact of this change in scoring.
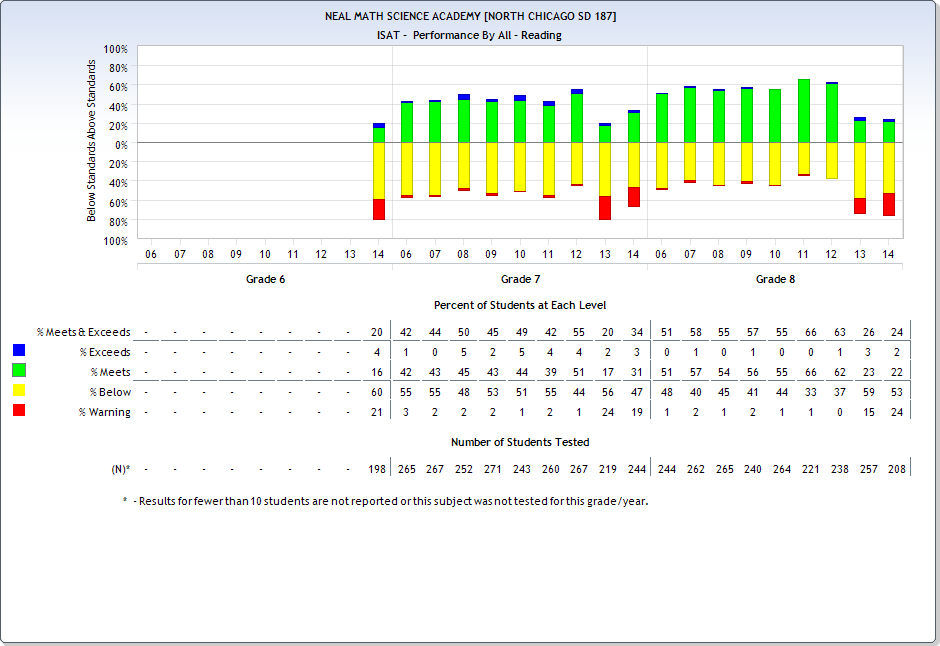
These results are from a middle school in northeastern Illinois. If you will click on the above chart documenting passing levels in reading on the Illinois State Achievement Test (ISAT), you will discover that the percentage of students meeting or exceeding reading expectations fell from 63% to 26% in 8th grade, and 55% to 20% in seventh grade between 2012 and 2013. I like how the chart adds 17 + 2 to get 20, but I assume that’s an issue of decimals I cannot see. Of note, almost no students exceeded expectations. In some years, none did.
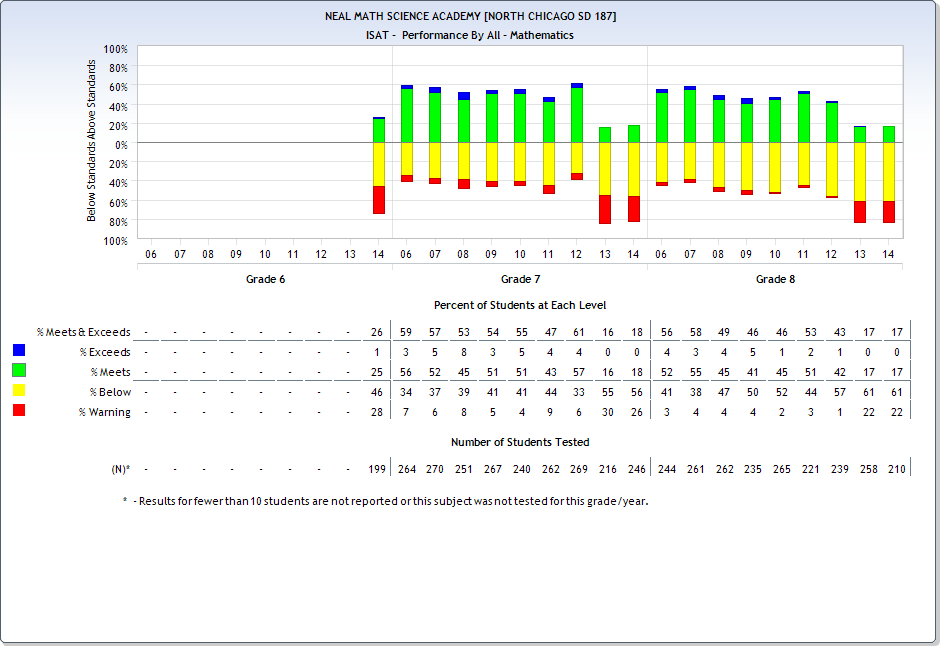
In math, scores fell from 43% to 17% for eighth graders between 2012 and 2013, and made a whopping descent from 61% to 16% in seventh grade. For the years 2013 and 2014, no students exceeded expectations in math in either grade.
These charts raise many questions. They should also raise flags. We are deciding teacher and administrator retention based on these numbers. But what are these numbers? Where do they come from? The fact that a school can change in one year from a passing rate above 1 in 2 to a rate of 1 in 5 speaks volumes about the social-science numbers we are using to document school performance, an issue that too seldom hits the radar. Illinois has a number of other states for company in the production of these volatile and suspicious passing rates. Who sets the passing rate for a state? The state does.
And, on another subject that I consider closely related to this one, who determines the score on a teacher’s evaluation? Evaluations are not “grievable” — which is to say that the union cannot help you if Fred decides to slam your performance. The problem of subjective administrators handing out personally picked numbers ought to receive more public attention. At least the ISAT numbers are based on standardized tests given across a state and should allow for reasonable comparisons between schools. Fred is just making up numbers in his office.
Eduhonesty: The larger problem I see is that we are drowning in fuzzy, social science numbers. Our data and its interpretation are presented as if the numbers represent reality. All I can say is, look at these charts. Which is reality? 2012? 2013? They can’t both be true — not in any objective sense anyway.